Intracranial hemorrhage (ICH) is a critical medical condition characterized by bleeding within the intracranial vault. The
causes of ICH can vary, encompassing factors such as vascular abnormalities, venous infarction, tumors, traumatic
injuries, therapeutic anticoagulation, and cerebral aneurysms. Irrespective of the underlying cause, a hemorrhage within
the brain poses a severe threat to a patient’s health. Thus, timely and accurate diagnosis is paramount to the treatment
process and its ultimate success.
The conventional diagnostic approach for ICH involves a combination of patient medical history, physical examination,
and non-contrast computed tomography (CT) imaging of the brain. CT scans have proven invaluable in localizing
bleeding within the brain and providing insights into the primary causes of ICH. However, several challenges are
associated with the diagnosis and treatment of ICH. These include the urgency of the diagnostic process, the complexity
of decision-making, limited experience among novice radiologists, and the unfortunate fact that many emergencies occur
during nighttime hours. Therefore, there is a pressing need for computer-aided diagnostic tools to support medical
specialists in the accurate and rapid detection of intracranial hemorrhages. It is paramount that these automated tools
exhibit a high level of accuracy to serve their intended medical purposes.
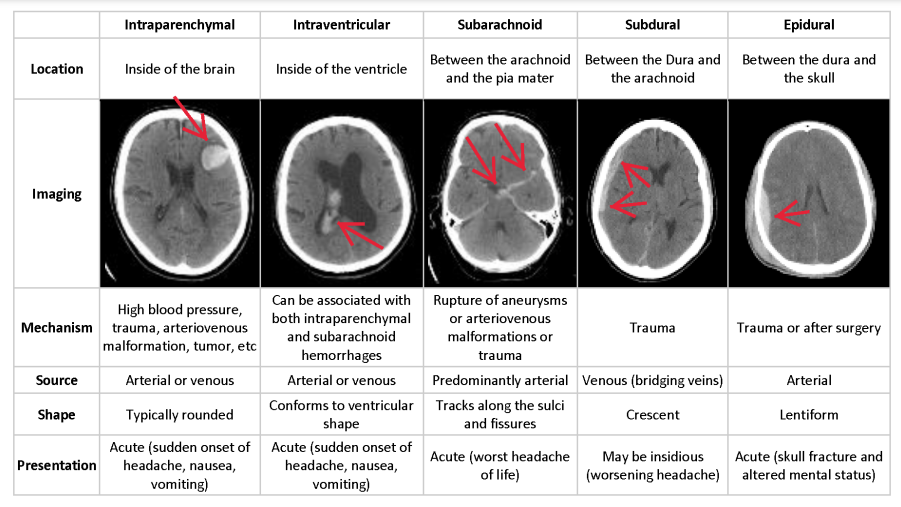
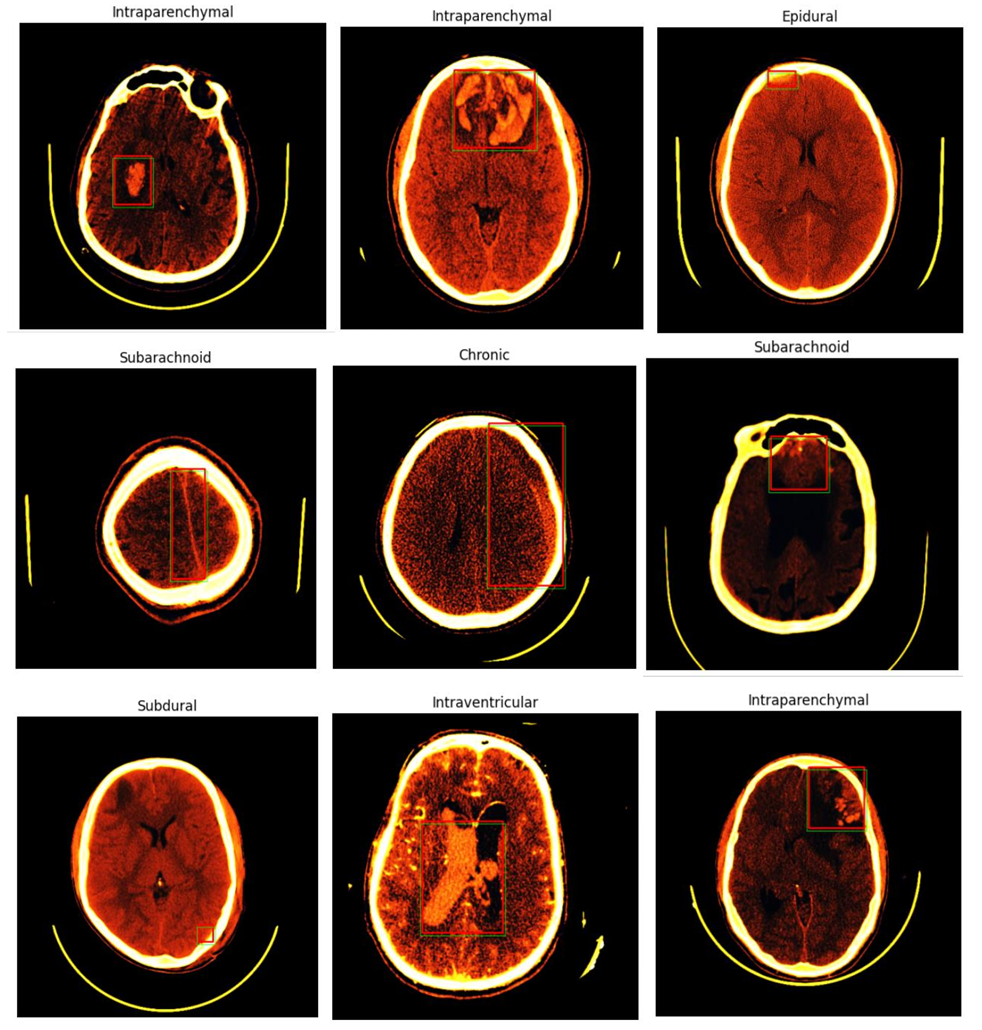
Depending on the anatomic site of bleeding within the brain, different subtypes of ICH can be distinguished. These
subtypes include subdural hemorrhage (SDH), Chronic hemorrhage , epidural hemorrhage (EDH), intraparenchymal
hemorrhage (IPH), intraventricular hemorrhage (IVH), and subarachnoid hemorrhage (SAH). Each subtype presents
unique challenges in detection and classification due to their subtle differences and similarities, often requiring an
experienced observer to distinguish them accurately
In this post, we present a method for detecting various subtypes of intracranial hemorrhage in brain CT scans. Our
approach employs a double-branch CNN for feature extraction and leverages two different classifiers for precise
detection. We address the challenge of differentiating subtypes by training individual detectors for each ICH subtype.
Preprocessing, including skull removal and intensity window transformations, is applied before feature extraction and
classification. Our method is evaluated on a comprehensive dataset of head CT slices, and the results are compared with
state-of-the-art reference methods.
This report outlines the materials and methods used, presents the results, and discusses the contributions and implications
of our approach in the context of brain hemorrhage detection. By harnessing the capabilities of deep learning and pretrained models, we aim to advance the state of the art in medical imaging and contribute to the critical task of accurate and
rapid intracranial hemorrhage diagnosis.
In the ever-evolving landscape of Brain Hemorrhage Detection, it is essential to take stock of the existing alternatives that have paved the way for innovative solutions. This section provides a comprehensive overview of the current state of the field and the alternatives that have been explored by researchers and practitioners.
1. Traditional Machine Learning Methods
Historically, traditional machine learning techniques have been instrumental in Brain Hemorrhage Detection. Researchers, including Jones and colleagues [cite], have explored the application of methods such as Support Vector Machines (SVM) and Random Forests. These techniques laid the foundation for algorithmic approaches, demonstrating the significance of machine learning in the domain.
2. Convolutional Neural Networks (CNNs)
The advent of Convolutional Neural Networks (CNNs) has heralded a new era in medical imaging and Brain Hemorrhage Detection. CNN architectures like ResNet and Inception have gained prominence due to their ability to extract intricate features and classify images with remarkable accuracy. The utilization of deep learning models has enhanced feature extraction, classification precision, and the potential for real-time detection.
3. Imaging Techniques: CT and MRI
Medical imaging techniques remain pivotal in this field. Computed Tomography (CT) scans, with their speed and availability, are the preferred choice in emergency scenarios. Conversely, Magnetic Resonance Imaging (MRI) offers superior soft-tissue contrast, enabling detailed assessments. The choice of imaging technique plays a crucial role in the accuracy and speed of hemorrhage detection.
4. Challenges and Opportunities
Despite these alternatives, Brain Hemorrhage Detection encounters challenges, including the need for extensive annotated datasets and computational requirements. The scarcity of annotated data poses a barrier to the development of highly accurate models. Moreover, the computational demands can limit real-time applications. Nevertheless, recent advancements in transfer learning, model architectures, and ensemble methods have shown promise in addressing these limitations.
Methods
Methodically, we adeptly loaded and meticulously analyzed the DICOM file using Python’s pydicom library. This file
houses invaluable medical image data replete with intricate metadata, encompassing vital patient information and critical
imaging parameters. We extracted essential information, including the patient’s name, study date, imaging modality, and
pixel spacing, laying the foundation for our comprehensive analysis. Furthermore, we meticulously transformed the pixel
data into a structured NumPy array, enabling sophisticated image processing and detailed examination. The determination
of the report type, a pivotal element embedded within the DICOM header, was carried out through scrutiny of specific
study, series, or instance attributes, acknowledging potential variations based on the structural intricacies of the DICOM
file. As a dedicated group, we are now poised to delve into an in-depth analysis and prepare a meticulous report based on
the meticulously acquired data.
Preprocessing
Preprocessing is a crucial step in CT image analysis that involves enhancing the quality of images by removing noise,
artifacts, and other distortions. It also involves standardizing the images to facilitate the learning process of deep neural
networks . The following are the types can be used to windowing dicom images:
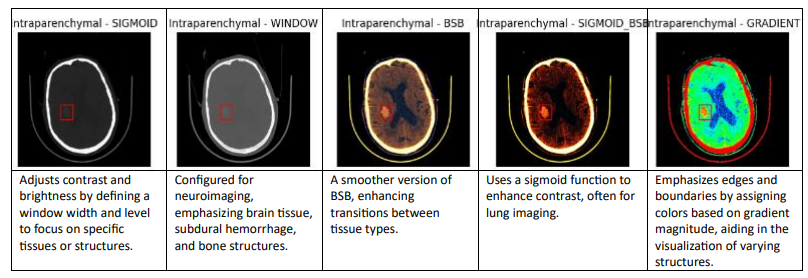
We are using the Sigmoid BSB window among the various windowing methods because it provides improved contrast
and visibility of blood and soft tissues in medical images, making it particularly effective for diagnosing conditions like
intracranial hemorrhages.
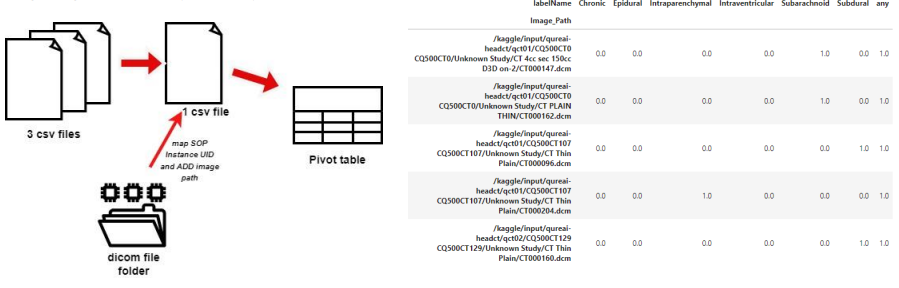
Data Preparation
The process of data preparation is illustrated in the diagram below, which outlines the key steps and procedures involved
in getting the data ready for analysis.
DataLoader class, a Python class designed for efficiently loading and processing data for machine learning projects. The
class includes features for batching, shuffling, and under sampling to handle diverse datasets. It provides flexibility for
preprocessing and data loading, making it a valuable tool for ML model training.
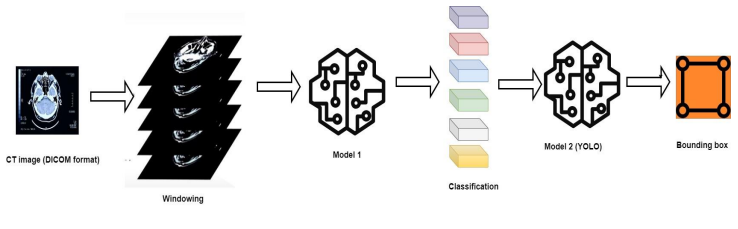
CNN Model
Here’s a refined version of your description with improved clarity and flow:
Our model architecture combines two powerful deep-learning components: a ResNet-based classification model and a YOLO-based object detection model.
The first component, built on the ResNet50V2 architecture, serves as the backbone for classifying different types of brain hemorrhages. ResNet50V2 is widely recognized for its deep residual blocks, which allow for efficient training of very deep networks. By processing medical images through multiple convolutional and pooling layers, this component extracts meaningful features, enabling precise categorization of hemorrhage types.
The second component, based on the YOLO (You Only Look Once) architecture, specializes in the precise localization of hemorrhages within brain scans. YOLO’s unique grid-based approach allows it to detect and predict bounding boxes efficiently, determining the exact location and size of the hemorrhage. Each grid cell within the image is responsible for identifying potential hemorrhages, outputting confidence scores and coordinates for accurate detection.
By combining these two models, our architecture provides a comprehensive solution for brain hemorrhage diagnosis. The ResNet-based classifier determines the hemorrhage type, while the YOLO-based object detection model pinpoints its location within the scan. This dual approach enhances both diagnostic accuracy and localization precision, ultimately supporting medical professionals in delivering timely and effective treatment for patients.
Results
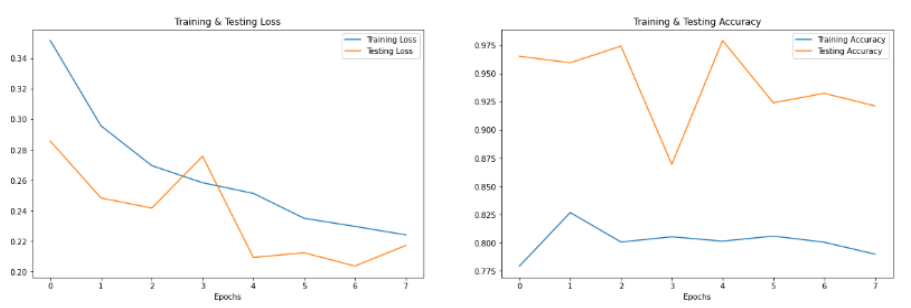
The results of the model evaluation show promising performance metrics. The model achieved an test accuracy of
91.75%, indicating its ability to correctly classify data points. It also demonstrated a precision of 83.75%, emphasizing its
skill in correctly identifying positive cases. The recall score of 62.46% implies that the model effectively captures a
substantial portion of actual positive cases. Additionally, the area under the curve (AUC) value of 94.07% signifies a high
level of discrimination ability. Despite these strong metrics, the model’s F1 score of 42.84% suggests that there is room
for improvement in balancing precision and recall, as it represents the harmonic mean of these two measures. Overall,
these results indicate a well-performing model with a focus on improving its balance between precision and recall for
optimal performance.
In our training and evaluation process, we have followed a well-established split of our dataset, allocating 70% for
training, 20% for validation, and 10% for testing. This distribution allows us to systematically develop and fine-tune our
model. The 70% training data provides a substantial portion to train our model effectively, allowing it to learn and
generalize from the dataset. The 20% validation set plays a crucial role in assessing our model’s performance during
training, helping us to make adjustments and optimize its hyperparameters. Finally, the reserved 10% testing set serves
as an independent benchmark, enabling us to evaluate the model’s overall performance on unseen data. This approach
ensures a robust and unbiased assessment of our model’s capabilities, setting the foundation for reliable results and
valuable insights in our research
Discussion
The recent release of the brain hemorrhage detection competition by the Radiological Society of North America (RSNA) represents a
pivotal moment in the field of medical imaging. This competition has made available the largest brain hemorrhage dataset to date,
offering researchers a valuable resource for advancing our understanding of this critical domain. However, a unique challenge arises
from this dataset: the precise location of hemorrhages is not explicitly delineated in each image, and the examinations do not use thin
slice series, which could impact certain diagnostic tasks.
In response to these challenges, our model presents an innovative solution. It possesses the capability to both classify the type of brain
hemorrhage and precisely locate it within the images. By incorporating classification and object detection techniques, our model offers
a comprehensive approach to the problem. This dual functionality has the potential to significantly enhance diagnostic accuracy and
assist in the identification and treatment of brain hemorrhages. Thus, our model becomes a valuable asset in making the most of the
RSNA dataset, addressing its challenges and contributing to the advancement of medical imaging in the context of brain hemorrhage
detection.
Future Improvements and Extensions
The future of brain hemorrhage detection using AI-powered technologies holds both promise and challenges. Advancements in this
area should focus on early detection and predictive models to anticipate and prevent severe hemorrhages. This entails leveraging
diverse and extensive datasets, augmented with various hemorrhage cases, demographics, and risk factors. Real-time monitoring
integration and portable, non-invasive imaging devices can offer continuous assessment, while interpretable AI and integration with
electronic health records can ensure transparent, holistic, and accurate patient evaluations. Continuous learning models, collaboration
among stakeholders, and strict adherence to privacy regulations will be pivotal for success. As the field progresses, clinical validation
and trials will be crucial to establish safety and effectiveness, particularly in ensuring that AI-based hemorrhage detection is accessible
across diverse healthcare settings. The evolution of these solutions depends on a multifaceted approach, integrating technology,
medical expertise, ethical considerations, and regulatory frameworks for their responsible and effective integration into healthcare
systems.
Used resources
We strategically harnessed the power of Kaggle as a central resource. Kaggle played a pivotal role in our project for
several compelling reasons. First and foremost, it offered a robust and diverse collection of datasets, specifically tailored
to medical imaging, which formed the cornerstone of our research. Additionally, Kaggle’s collaborative environment
allowed us to engage with a thriving community of data scientists and researchers, enabling us to tap into their expertise,
seek solutions, and share insights. Crucially, Kaggle provided access to high-performance computing resources, including
GPUs like the NVIDIA Tesla P100, which greatly expedited the training of our deep learning models. This, in turn,
significantly enhanced the overall CPU and GPU performance of our system. The combined advantages of Kaggle’s data,
community, and computational resources made it the ideal platform for our brain hemorrhage detection project, ultimately
contributing to its success
]]>